
Just because the overall population of Rapid City is slowly increasing does not mean that the local K-12 population is increasing. In fact, using historical Rapid City School District 51-4 data, in 1991-1992 school year there were 13,873 enrolled K-12 students in the district. In the 2022-2023 school year, there are 12,643 K-12 enrolled students in the district. In other words, in the last 32 years, enrollment in the RCSD 51-4 has DECLINED by 1,230 students or 8.87% – which any reasonable person with even a modicum of statistical knowledge would best describe this K-12 student enrollment trend as a DECLINING TRENDLINE as can be easily seen in EXHIBIT 5 below.
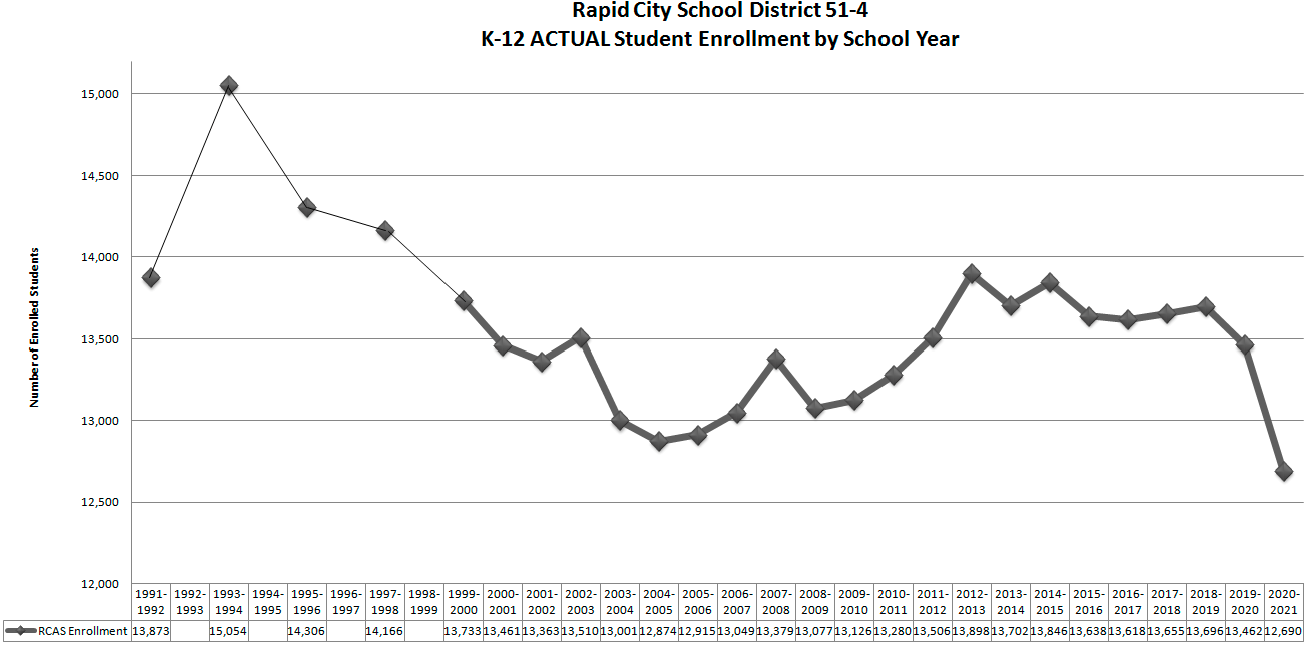
EXHIBIT 5: RAPID CITY SCHOOL DISTRICT 51-4 K-12 ACTUAL STUDENT ENROLLMENT BY SCHOOL YEAR (SOURCE: SOUTH DAKOTA DEPARTMENT OF EDUCATION)
Former RCAS Assistant Superintendent Dave Janak drew a similar conclusion regarding RCSD 51-4 student enrollment in this RCJ article: More school cuts could follow enrollment drop in Rapid City schools. The article stated, "the trend of stagnant or falling enrollment isn't new to the district. At the lowest, Janak said enrollment has dropped to around 12,500. At the highest, he said it comes to about 14,000. While the community as a whole is growing, some of that growth comes from retirees who move here, Janak said. So even if the city population rises, it doesn't mean there will be more students in public schools."
The Cohort Survival Model from the 2016 MGT report confirms this observation. Page 40 of the MGT report states, “Further, the Cohort Survival Model also uses historical enrollment numbers, but takes into account student-mobility patterns and the effects of the natality rates in prior years. The Cohort Survival Model is perhaps the best-known predictive tool using this type of data.” Exhibit 4-19 on this same page shows the weight weighting factor of 35% for all the demographic models used, implying that MGT thought that the Cohort Survival Model was the most accurate for RCSD 51-4 K-12 population projections. On Page 41 of the MGT Report, Exhibit 4-20 plots the current and projected enrolled student data for RCSD 51-4. The Cohort Survival Model (colored Orange with triangle) predicts a “K-12 population flatline” identical to the 30 years of historical data back to 1991-1992. The Cohort Survival Model never exceeds 14,000 enrolled students in any year (2016-2017 school year through 2025-2026 school year). Unfortunately a COMPOSITE model (Exhibit 4-19, MGT Report Page 40) was used to create a "K-12 Base Model" for the Enrollment Projections which has proven in 4 of 4 (2016-2017 to 2019-2019) school years to have a statistically significant upward bias leading to inaccurate K-12 student enrollment projection results as seen in EXHIBIT 6 below.
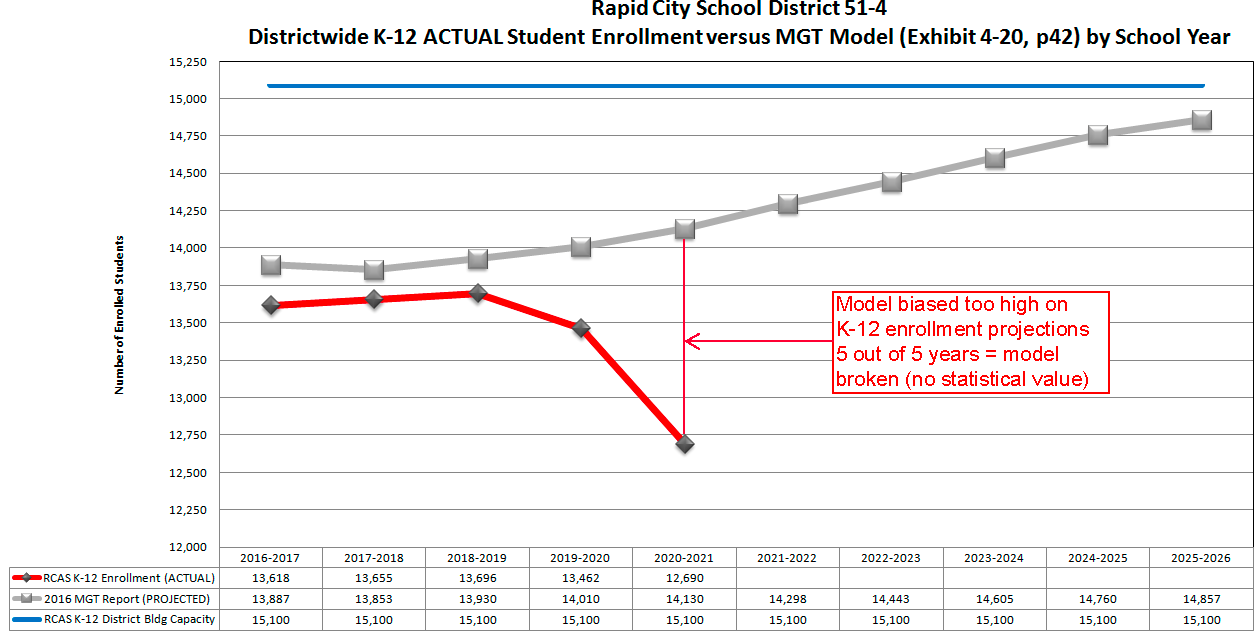
EXHIBIT 6: RAPID CITY SCHOOL DISTRICT 51-4 K-12 ACTUAL STUDENT ENROLLMENT VERSUS MGT MODEL (EXHIBIT 4-20, p42) BY SCHOOL YEAR (ANALYSIS OF PUBLICLY AVAILABLE DATA)
Some may ask what difference does it make in the real world if your K-12 Student Enrollment Model is inaccurate? The answer: If RCAS decision makers (Board of Education and Superintendent) are utilizing and depending upon an upwardly biased K-12 enrollment model to make decisions - there is a very high probability the decisions made will be incorrect and the RCSD 51-4 taxpayers will foot the $290.6 $309.5 million bill for these errors! In addition, the 2019-2020 RCSD 51-4 enrollment data had NEITHER been released to the public NOR placed on the agenda or discussed at any PUBLIC Board of Education Meeting at the time the Board of Education approved the bond (10/28/2019 Special Board of Education Meeting by a 6-1 vote). Did the members of the Board of Education know before they voted to approve there was a material and significant decrease in enrollment, specifically in K-5 (EXHIBIT 7 AND 8) in particular and to a lesser extent in 6-8 (EXHIBITS 9 AND 10)? If they did not know, they simply had not done their job in conducting required due diligence and hence did not appropriately represent the taxpayers/voters of their respective Area 1 through 6! If they did know, they simply ignored reality and are attempting to stick the taxpayers with an unnecessary $290.6 $309.5 million bill! Please note the Board of Education member from Area 7 voted AGAINST the school bond as she thought it was too much of a long-term tax burden on her constituents.
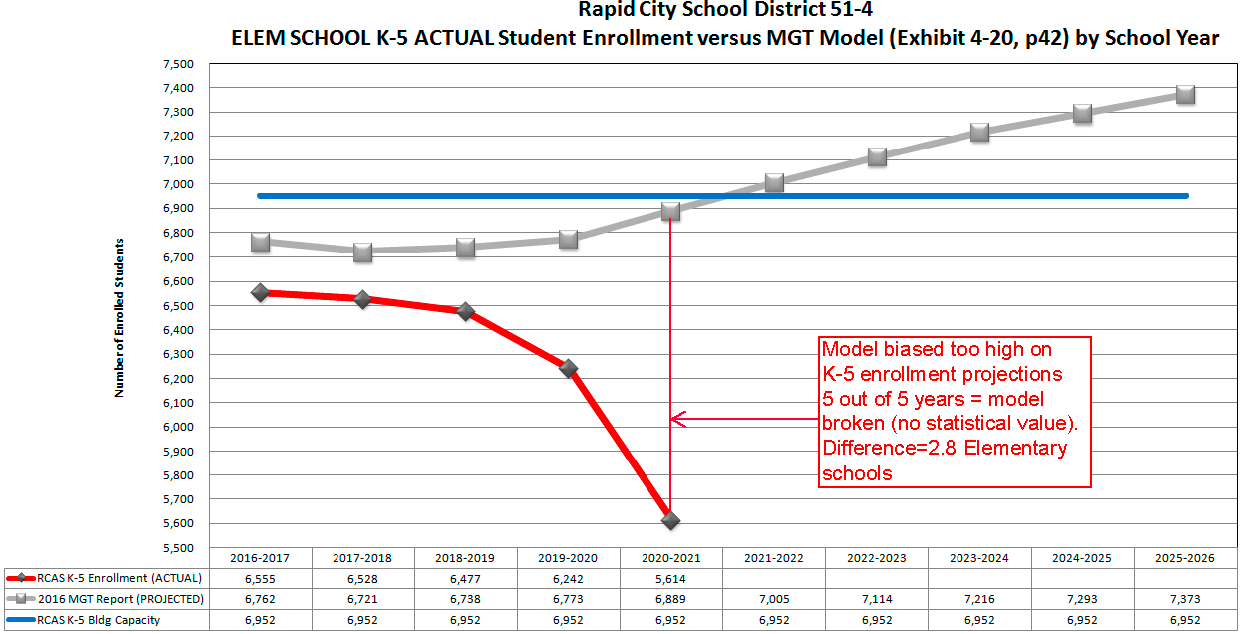
EXHIBIT 7: RAPID CITY SCHOOL DISTRICT 51-4 ELEMENTARY SCHOOL K-5 ACTUAL STUDENT ENROLLMENT VERSUS MGT MODEL (EXHIBIT 4-20, p42) BY SCHOOL YEAR (ANALYSIS OF PUBLICLY AVAILABLE DATA)
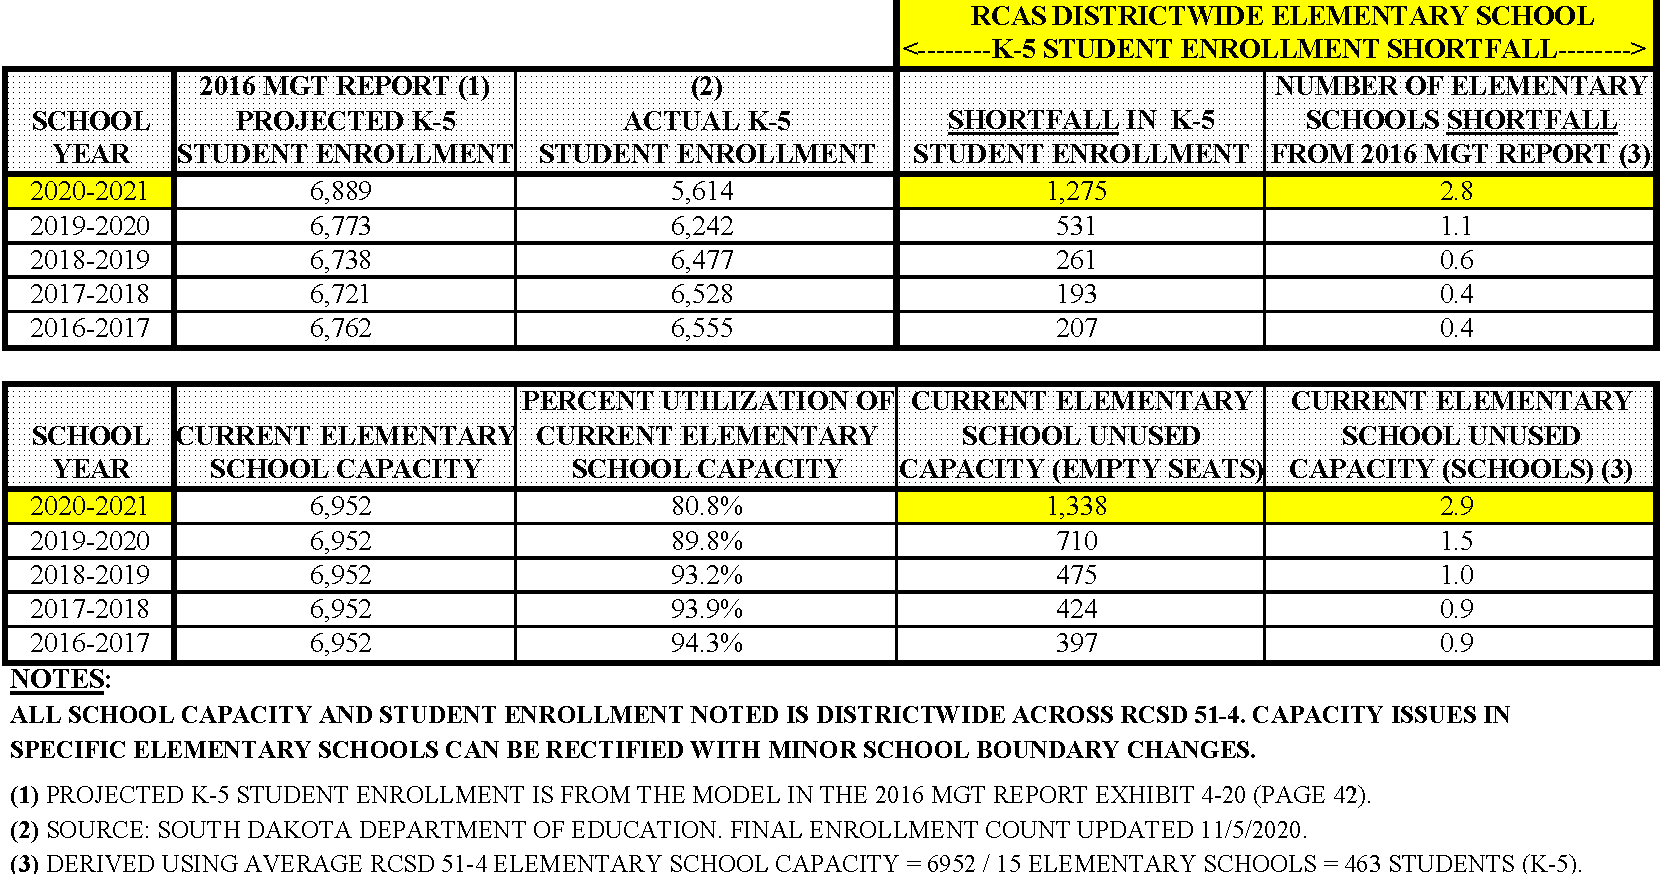
EXHIBIT 8: TABLE - RAPID CITY SCHOOL DISTRICT 51-4 ELEMENTARY SCHOOL K-5 ACTUAL STUDENT ENROLLMENT VERSUS MGT MODEL (EXHIBIT 4-20, p42) AND CURRENT DISTRICTWIDE K-5 BUILDING CAPACITY BY SCHOOL YEAR (ANALYSIS OF PUBLICLY AVAILABLE DATA)
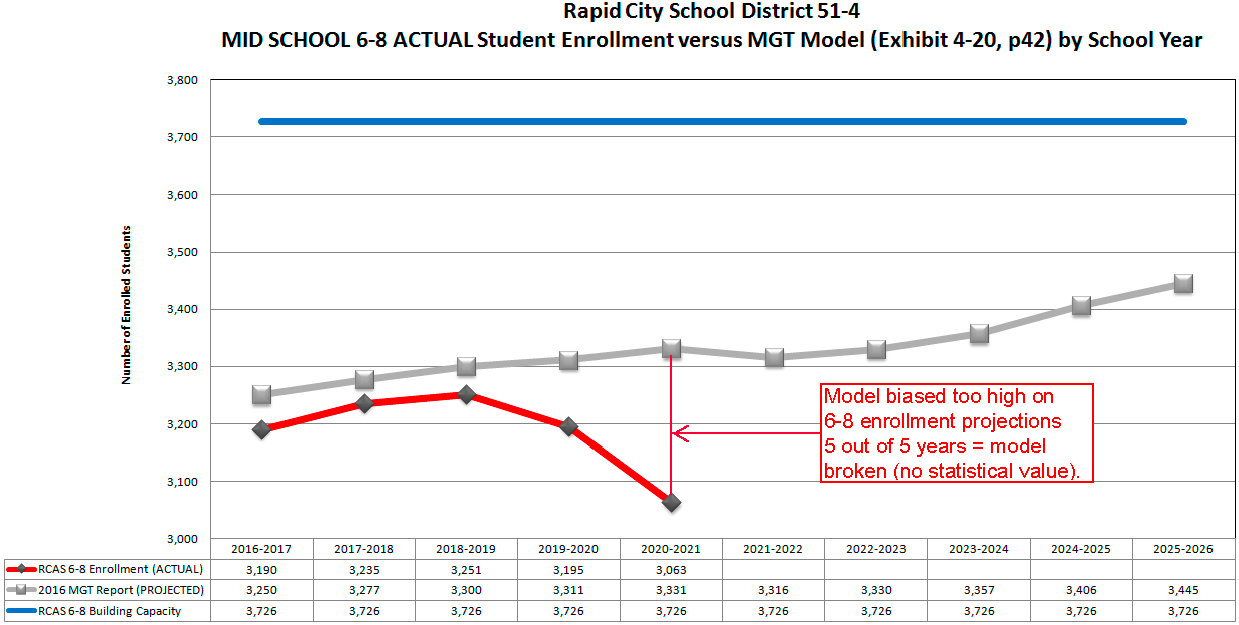
EXHIBIT 9: RAPID CITY SCHOOL DISTRICT 51-4 MIDDLE SCHOOL 6-8 ACTUAL STUDENT ENROLLMENT VERSUS MGT MODEL (EXHIBIT 4-20, p42) BY SCHOOL YEAR (ANALYSIS OF PUBLICLY AVAILABLE DATA)
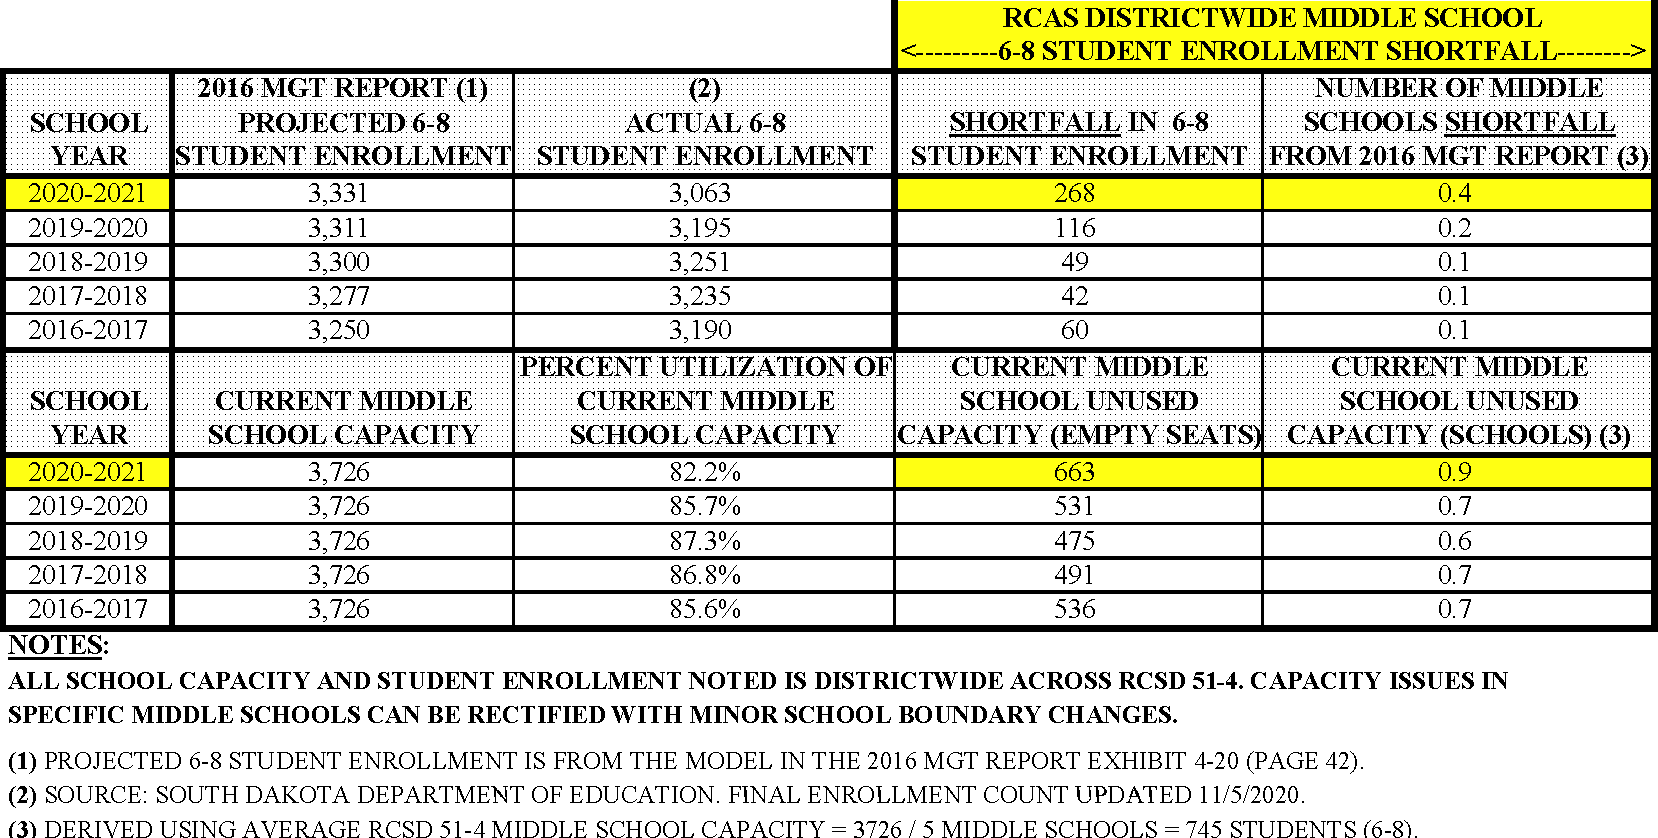
EXHIBIT 10: TABLE - RAPID CITY SCHOOL DISTRICT 51-4 MIDDLE SCHOOL 6-8 ACTUAL STUDENT ENROLLMENT VERSUS MGT MODEL (EXHIBIT 4-20, p42) AND CURRENT DISTRICTWIDE 6-8 BUILDING CAPACITY BY SCHOOL YEAR (ANALYSIS OF PUBLICLY AVAILABLE DATA)
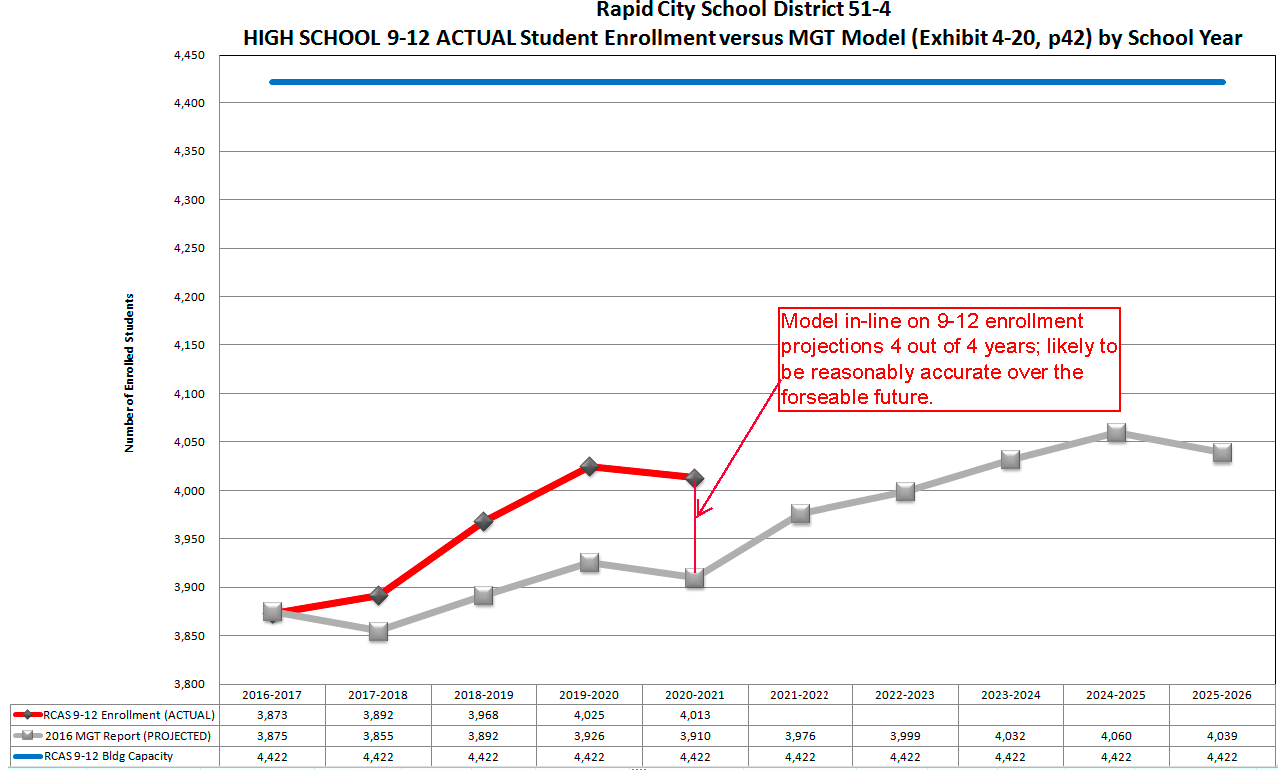
EXHIBIT 11: RAPID CITY SCHOOL DISTRICT 51-4 HIGH SCHOOL 9-12 ACTUAL STUDENT ENROLLMENT VERSUS MGT MODEL (EXHIBIT 4-20, p42) BY SCHOOL YEAR (ANALYSIS OF PUBLICLY AVAILABLE DATA)
EXHIBIT 12 shows another method to analyze K-12 Student Enrollment population dynamics called Pipeline Analysis. Pipeline Analysis specifically looks at the number of K-12 students entering Kindergarten (K), Sixth Grade (6), and Ninth Grade (9) - the shape of the curve for each year and the changes in the curve from year to year. For very quickly growing school districts, K enrollment should be greater than 6 enrollment which is in turn greater than 9 enrollment. For school districts with slow growth, K enrollment should be approximately equal to 6 enrollment and also approximately equal to 9 enrollment. For school districts with zero or negative growth (declining enrollment), K enrollment should be less than 6 enrollment which is in turn less than 9 enrollment. This is exact enrollment pattern RCSD 51-4 is currently undergoing with more K-12 students leaving the pipeline versus entering the pipeline.
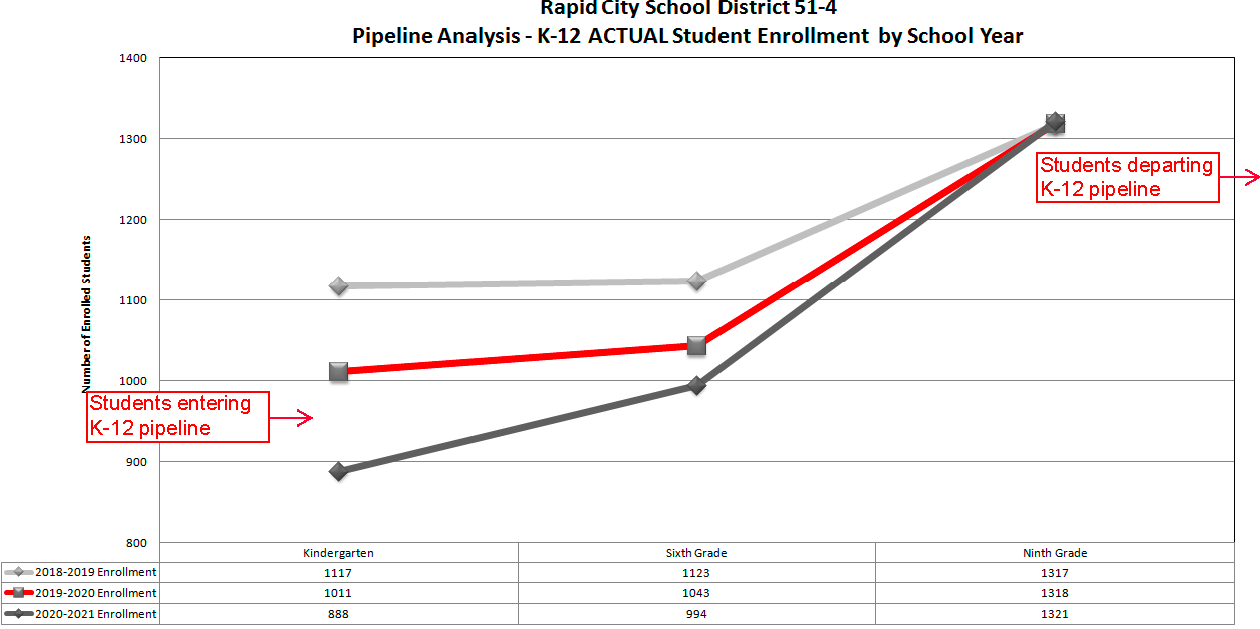
EXHIBIT 12: RAPID CITY SCHOOL DISTRICT 51-4 PIPELINE ANALYSIS - K-12 ACTUAL STUDENT ENROLLMENT BY SCHOOL YEAR (ANALYSIS OF PUBLICLY AVAILABLE DATA)
In addition to all the above, RCSD 51-4 is losing many local students to homeschooling, private schools, transfers out to nearby public school districts, early graduations, and dropouts. We expect this trend to continue or even accelerate due to declining Academic Performance which would lead to further reductions in future enrollment.
All the data provided above proves that RCSD 51-4 does NOT have a growing K-12 student enrollment trendline it has a DECLINING trendline! A primary reason given for the $189.553 million school bond by both the RCSD 51-4 Board of Education and the Superintendent has been largely been predicated on a "Growing School District." There is simply no data available of RCSD 51-4 student enrollment to support or justify this conclusion. For this reason alone, on February 25, 2020, please join us in voting NO on the largest school bond in South Dakota history! The RCSD 51-4 taxpayers simply cannot afford to incur an additional $290.6 $309.5 million to be repaid over the next 25 years for decisions based on inaccurate demographic assumptions.
NOTE: All the Student Enrollment Data above reflect the number of students enrolled in the Rapid City School District 51-4 on the last Friday in September for the year shown. To be included in the count, students must be enrolled more than 49 percent of the school day. These numbers may differ from State Aid Fall Enrollment, which is calculated in a slightly different way. In short, state aid fall enrollment includes all of the students for whom a district is financially responsible. Since the data is nearly identical, regardless of if Student Enrollment Data or State Aid Fall Enrollment is used for the analysis the conclusion is precisely the same.